
eGrocery Performance Benchmarking 2021
Part 3: Quartile Analysis

This report provides critical data and insights on the eGrocery market to understand the attributes that drive online grocery sales growth.
- U.S. online grocery sales data from 949 physical stores representing 45 grocery brands.
- 4 week eGrocery sales consumer behavior study.
- Inform your grocery strategy and rise above the competition.
Access the 30 page report for free!
Created and conducted by Brick Meets Click | Sponsored by Mercatus, Hussman and Cardylitics


eGrocery Insights Shared in the Part 3 Report

Weekly sales per store

Weekly orders per store

Household metrics for Store’s Zip Code
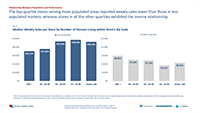
Relationship between population and sales performance
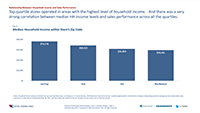
Relationship between household income and sales performance

Active customer base analysis

Order frequency

Mix of customers

Prevalence and preference for online grocery service types

Sales performance by online grocery service type

Dominant service type configurations

Dominant pickup configurations
And much more!
Get all of the data and insights in this online grocery sales and service benchmarking report not available elsewhere.
Learn what the top performing online grocery stores and brands are doing differently
About Mercatus
Mercatus is committed to helping grocery retailers to operate and control their own eCommerce experience, with a highly profitable customer-centric growth strategy. Empowering grocers to adapt to today's changing consumer demands with an end-to-end enterprise-grade SaaS platform.
The Mercatus platform is used by leading North American retailers, including Weis Markets, Save Mart brands, Brookshire's Grocery Company brands, WinCo Foods, Kowalski's, Smart & Final, Stater Bros. Markets and others.
© MERCATUS 2022. All Rights Reserved